MadgeTech Blog

Freezer Performance Monitoring in Frozen Food Manufacturing

Raspberries on a metal conveyor in a food-processing plant, gloved hands handling berries, with a dark blue banner showing the text 'Freezer Performance Monitoring in Frozen Food Manufacturing'. Posted on

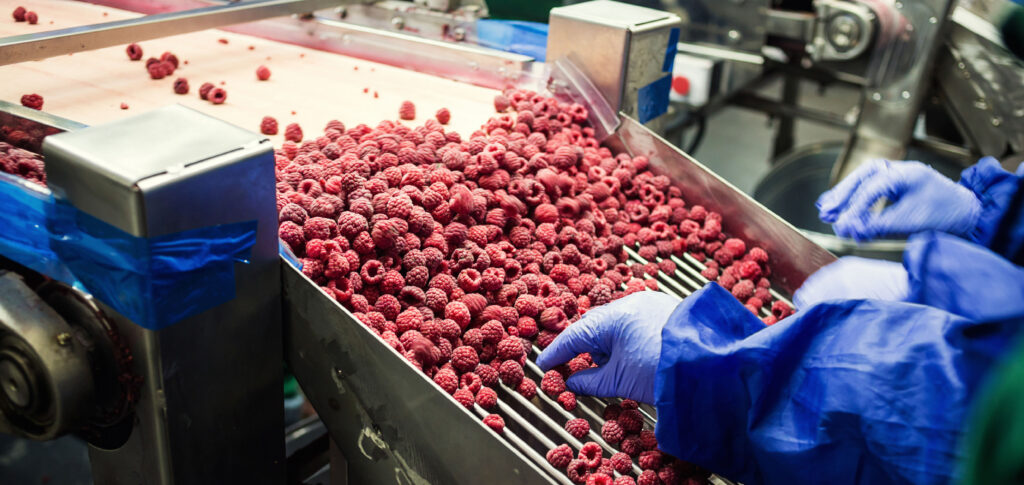
In a frozen food manufacturing facility, freezers work constantly behind the scenes to preserve product quality as it moves through the production process. From vegetables and seafood to prepared meals and frozen desserts, these products depend on stable low temperatures to maintain their texture, flavor, and safety until they reach consumers.

Although industrial freezers are designed to maintain consistent conditions, the environment inside them can change more than expected during normal operations. Doors open as pallets are moved in and out, compressors cycle on and off, and airflow shifts as racks and products are rearranged. Over time, these factors can create temperature differences across various areas of the freezer.

For quality teams, understanding how these conditions behave throughout the freezer is an important part of maintaining consistent product storage.

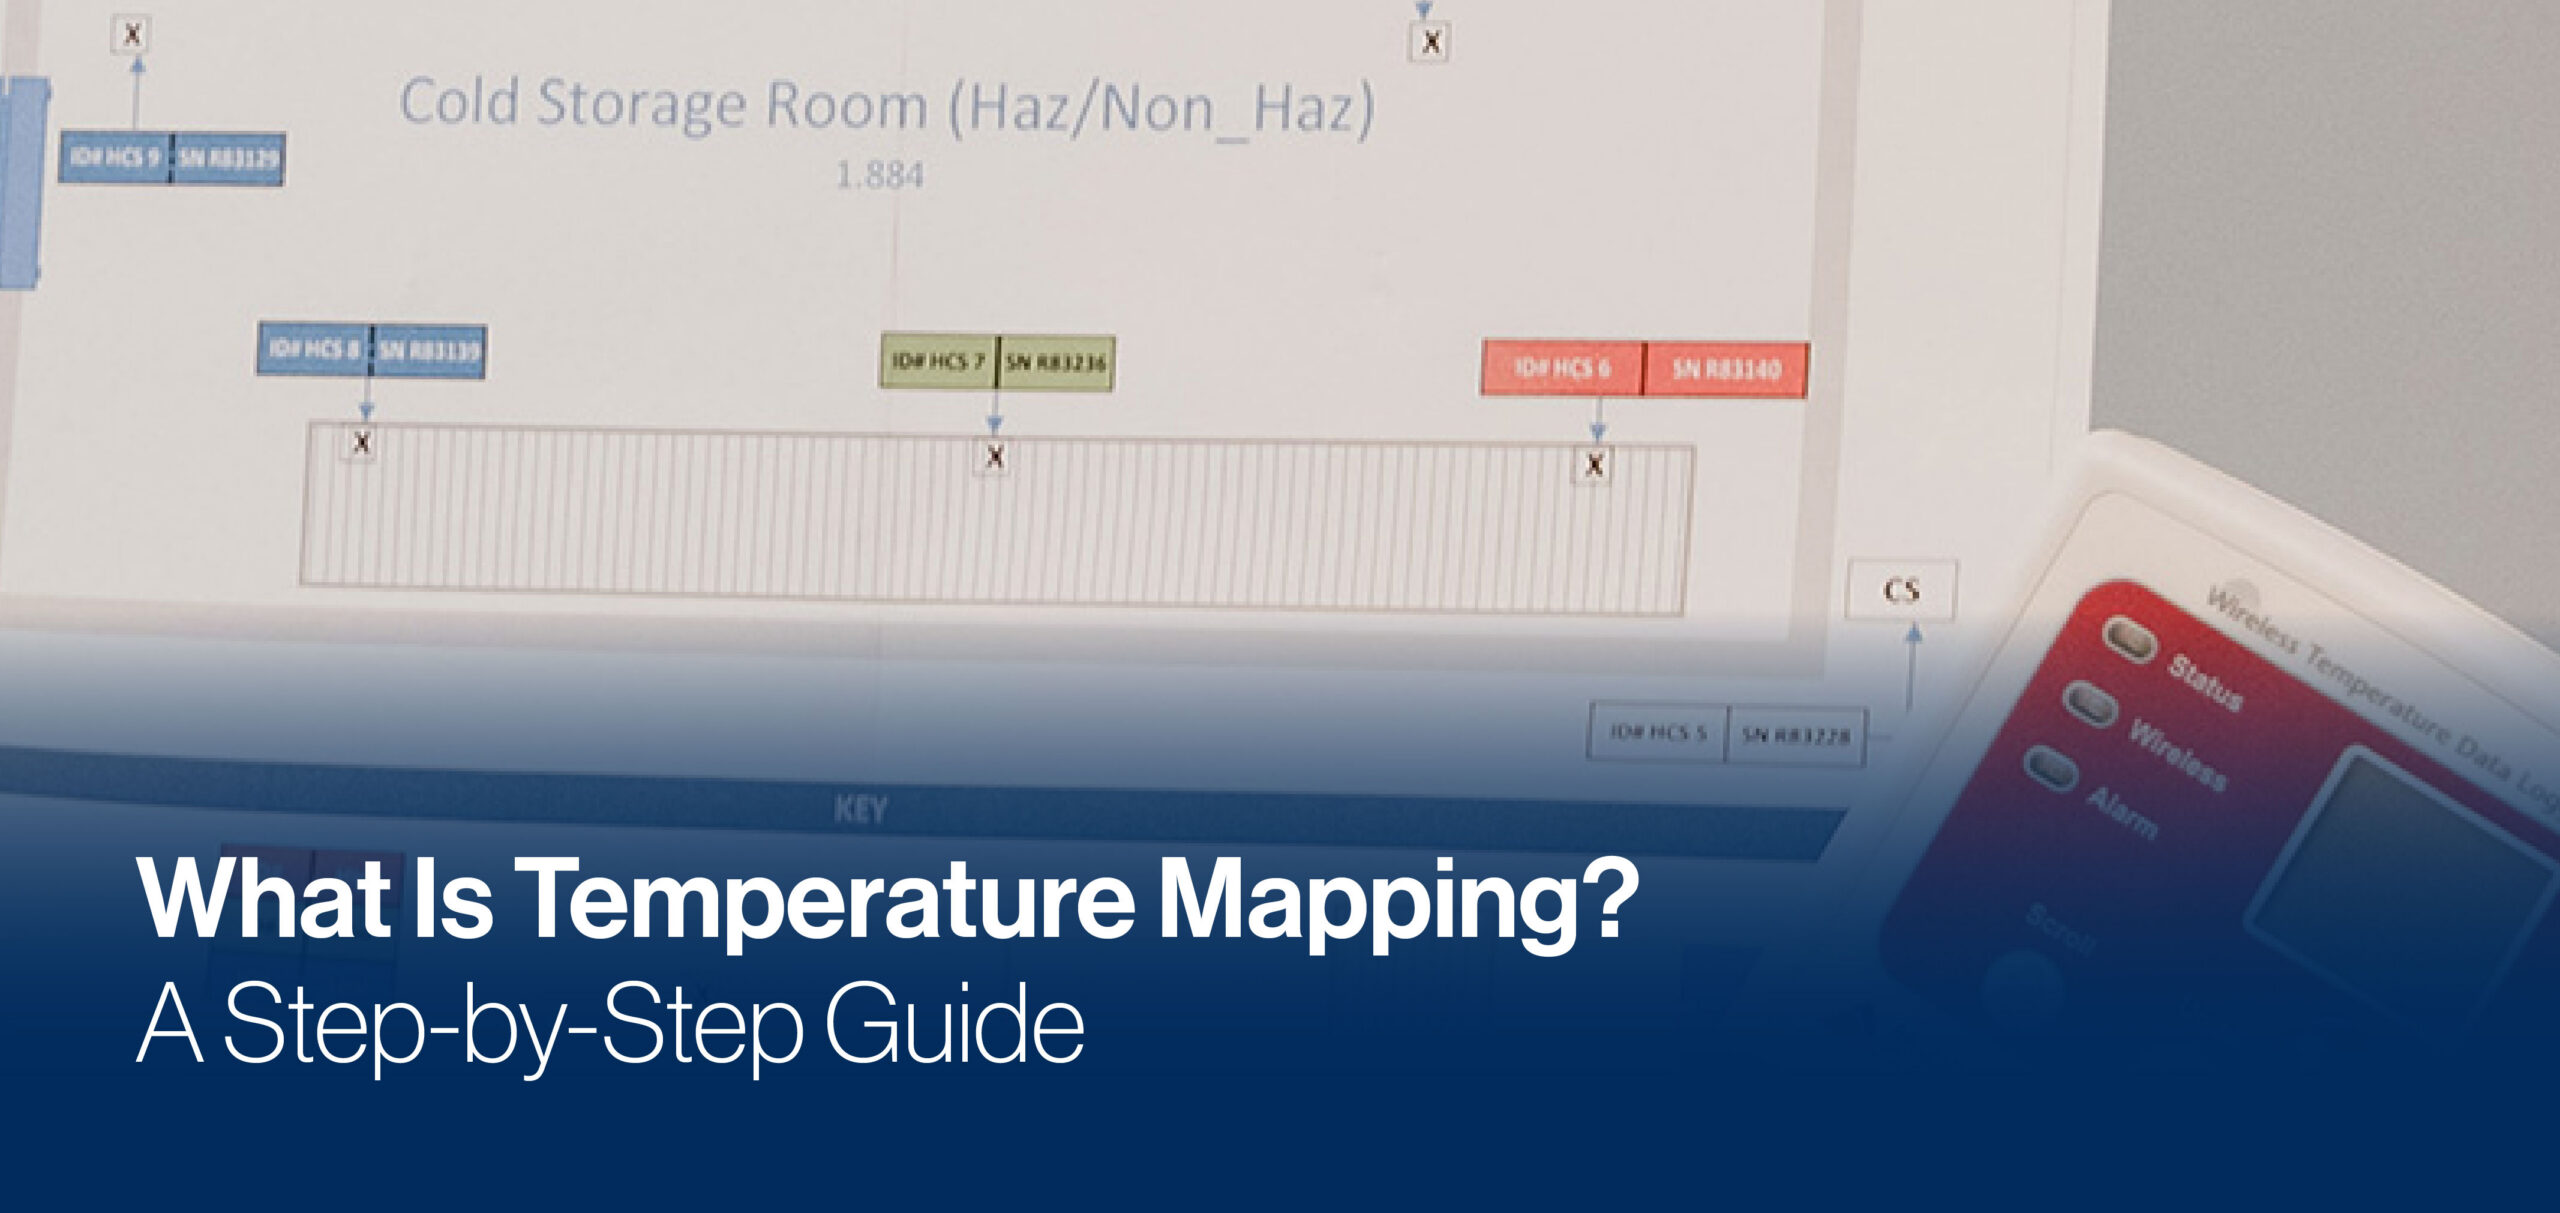
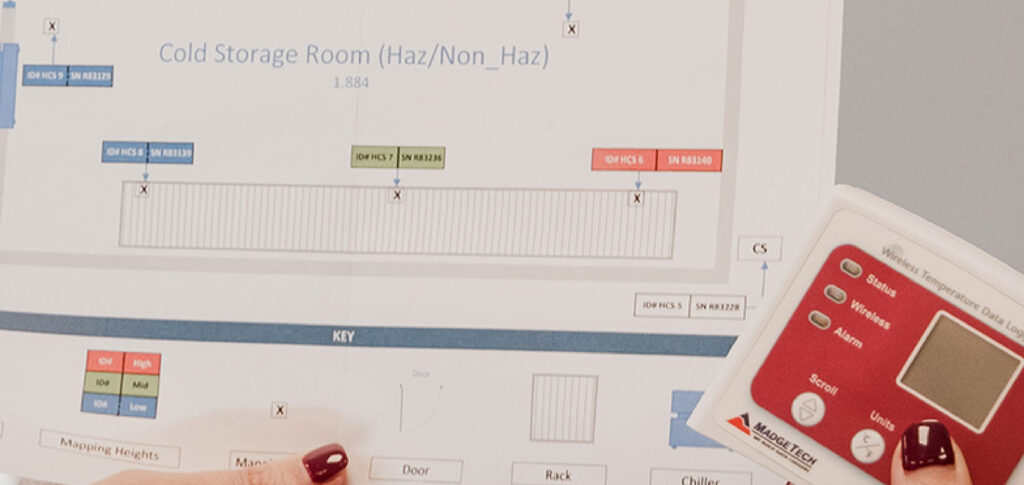
Temperature monitoring helps reveal how the system performs during real operating conditions. Sensors placed at multiple locations can record temperature trends over time, allowing operators to observe how temperatures respond during production cycles, heavy loading periods, or overnight storage.

Monitoring tools such as the RFTCTemp2000A thermocouple data logger are often used in these environments. Because the device works with external thermocouple probes, sensors can be positioned directly inside freezer spaces while the logger records detailed temperature data. This setup allows facilities to continuously monitor conditions and capture temperature variations across different areas of the freezer.

Reviewing this data can help identify patterns such as warmer zones near frequently opened doors or areas where airflow may be restricted by storage configurations. With this information, operators can adjust equipment settings, improve product placement, or optimize airflow within the freezer.

In frozen food manufacturing, consistent temperature control is critical to protecting product quality. By monitoring freezer performance and reviewing temperature trends over time, facilities gain valuable insight into how their freezing systems perform and can make informed decisions to maintain stable storage conditions.

What Is Temperature Mapping? A Step-by-Step Guide

Hero banner for 'What Is Temperature Mapping?': a cold storage diagram with labeled zones and a blue gradient title overlay. Posted on

Walk into a large storage room, and the temperature display on the wall might say everything is perfectly controlled. But that single number rarely tells the full story. In large spaces such as warehouses, cold rooms, laboratories, or pharmaceutical storage areas, temperatures can vary from one location to another. Temperature mapping is the process used to understand those variations.

Temperature mapping begins with planning the study. The goal is to determine how conditions behave throughout a space, so sensors are placed in multiple locations. These points typically include areas near doors, walls, shelving units, and central storage locations.

Once the monitoring points are selected, temperature sensors or data loggers are positioned throughout the space. The devices are placed at different heights and locations to capture a complete picture of how temperatures may change within the environment.

The next step is the monitoring period. Over several hours or days, the sensors record temperature readings at regular intervals. This continuous data collection allows facilities to observe how conditions change during normal operations, such as when doors open, equipment cycles on and off, or staff move materials through the area.

After monitoring is complete, the collected data is reviewed. Temperature graphs and reports help identify patterns across the room. This analysis can reveal areas that remain slightly warmer or cooler than others, commonly called hot or cold spots.

The final step involves using these findings to improve environmental control. Facilities may adjust airflow, reposition shelving, or relocate sensitive materials to areas with the most stable conditions.

Temperature mapping provides a clearer understanding of how controlled environments truly behave. By studying conditions throughout a space, organizations can ensure that storage and processing areas maintain the consistency required to protect sensitive materials.

Reducing Human Error: Replacing Manual Logs with Automated Monitoring

Posted on

For many years, environmental monitoring relied on a simple routine. A technician would walk through a facility, check a thermometer or gauge, write down the reading on a log sheet, and move on to the next location. The process was straightforward, but it depended entirely on human consistency.

Manual logs can work well in smaller environments, yet they also introduce several opportunities for error. Readings may be recorded at slightly different times each day, handwriting can be difficult to interpret, and occasional entries may be missed altogether during busy shifts. Even when procedures are carefully followed, manual monitoring captures only a single moment in time rather than a complete picture of environmental conditions.

Automated monitoring systems approach the same task differently.

Instead of relying on periodic checks, digital data loggers continuously measure environmental conditions such as temperature or humidity. These devices record readings at user-specified intervals throughout the day and night, creating a detailed record of how conditions change over time.

This continuous data collection offers several advantages. If environmental conditions begin to drift outside acceptable ranges, the change can be detected more quickly than with scheduled manual checks. Automated records also eliminate issues related to handwriting, missed entries, or inconsistent measurement times.

Another benefit is the ability to review historical trends. Rather than relying on individual log entries, facilities can analyze temperature patterns over days or weeks to identify potential equipment issues or operational changes that affect environmental stability.

Replacing manual logs with automated monitoring does not remove the need for oversight, but it does reduce the potential for human error in routine data collection. By allowing technology to handle continuous measurement and recordkeeping, organizations can focus more on analyzing environmental data and maintaining stable conditions across their operations.